ADfartechx has assisted clients from different countries for more than 18+ years. Our teams of experts have implemented more than 1300+ successful projects, including data analytics and visualization Comment end services. Innowise’s data engineers skillfully take advantage of diverse data visualization tools in order to determine market trends and assess business
Do you need data analytics and visualization services?
In the early stages of establishing a business, it is possible to encounter large volumes of data that may not be appropriately allocated. As a result, effective project growth can be postponed. Our experts at Innowise provide data visualization services that ultimately help you deal with plenty of data. Here’s what’s included in our suite:
Data visualization consulting
Our data consultants always assist customers in selecting valuable data. Therefore, it becomes possible to optimize costs in all business sectors and find new solutions.
Data visualization implementation
Our team of experts can implement the most convenient and reliable data visualization solutions. This will help to extract the right data and provide new insights on the needs of the target audience.
Data platform development
We know how to develop a data visualization platform that can customize data integration from sources, create a centralized repository, provide data protection and improve reporting and final visualization.
Data visualization software development
Our engineers develops bespoke data visualization solutions for clients worldwide. This helps businesses notice new trends and react quickly to changes.
Custom reports and dashboard development
Improve your business analytics by creating tailored dashboards and reports that show the key metrics for growing your company.
Data analytics and visualization optimization
ADFAR Tech experts also provides audit services for businesses, taking full advantage of artificial intelligence and machine learning technologies. We help companies adjust their business strategies, ensuring a high level of automation and reducing erroneous actions.
Best data visualization tools and platforms in 2023
ADFAR uses the most advanced and reliable data visualization tools and solutions for business needs. They can become an efficient solution for visualizing data in different ways depending on your project. Our experts favor the following best data visualization tools listed below.
Tableau
We use this platform as one of the most in-demand visualization programs that can perform in-depth analysis based on large databases and can work with multiple integrated sources at once.
Microsoft Power BI
This is comprehensive software for detailed analysis of business results. The package contains the most necessary data visualization solutions that can process large data layers into convenient charts, tables, and summaries.
Qlik Sense
Data engineers at Innowise consider Qlik Sense indispensable for rapidly creating workflows with large volumes of information, which can turn them into interactive panels, dashboards, and all kinds of reports.
Looker
This handy platform enables users to customize visual representations of data based on their interests. Looker also provides access to an extensive library of different types of visual representations.
The cost of creating a data science solution
Data science is one of the most in-demand services, yet the project’s total cost always depends on its complexity. Innowise offers top-notch quality for reasonable prices at Central Europe and Baltics rates. See below the complete set of factors that determine the overall cost.
Enterprise performance
Monitor KPIs of your entire departments and individual employees
Analytics of your direct competitors as well as products
Procurement overview and supplier validation
Manufacturing
Analysis of equipment efficiency at different stages of operation
Detection of deficiencies during the production process to eliminate them
Predictions of equipment performance when replacing or improving equipment
Supply chain
Identification of goods demands entry points
Detailed planning and management of orders with suppliers
In-depth analysis of procurement costs
Forecasting of risks of ordering from suppliers
Structural optimization of all logistics
Marketing and sales
Analysis of customer engagement and sentiments to improve service quality
Planning and forecasting the impact on customers from marketing campaigns
Budget analysis for marketing activities
Analyzing the solvency of the clients for building promotional campaigns
Financials
Monitoring of budget data
Forecasting and identification of risks
Identifying the most important areas of income and expenses
Recruiting and HR
Analyzing employee sentiment and retention processes
A complete breakdown of the entire department and employee performance
Planning the development of an employee performance improvement plan
Maintenance
Analysis of equipment, services, and resources
Maintenance planning
Operational risk analysis
Security
Cyber security analysis of site and servers
Fraud detection
Threat assessment analysis
Location and platform sourcing monitoring
Data visualization solutions: must-have features
DFAR uses the most advanced and reliable data visualization tools and solutions for business needs. They can become an efficient solution for visualizing data in different ways depending on your project. Our experts favor the following best data visualization tools listed below.
Dashboards and reports customization
The platforms offered by the Innowise are able to adjust to any of your needs. You can customize styles of charts, widgets, elements, and much more due to special libraries with thousands of settings, including the dashboards.
Data filtration
One of the key features is that you can customize filters in different platforms to get the right datasets for analytics. Subsequently, they will be able to cleanse, collect, record, and redirect data from different sources.
Version history
This function can dramatically help under any circumstances when you need to retrieve data from your old versions of reports. One can easily fix any errors, and structure the actual data visualizations based on your fixes.
Mobile optimization
Flexibility allows you to continuously analyze and visualize data on any device, including mobile devices. By integrating different platforms, one can line up the exact location of the data on the screen of your mobile device, making it easy to monitor continuously.
Data visualization use cases
For the productive work of a company, it is important to know the overall picture of production, finances, and much more. That’s why Innowise offers to collect the information in a single piece, visualize each point, and then highlight strengths or weaknesses of a business. The main data visualization benefits for business include:
AWS data visualization
Amazon Web Services is a cloud platform that presents a wide range of services that perform sophisticated analytics. As a result, business owners can receive insightful predictions and comparisons with major competitors. Innowise actively uses this tool to pinpoint various performance metrics.
Data visualization with Google Data Studio
This app is more commonly referred to as “google data visualization” because this tool is central to the ecosystem for transforming data into detailed reports, graphs and charts. Reports can be edited in real-time and customized, based on a large library of components.
Azure data visualization
ADFAR also uses a service from Microsoft, which provides an excellent computational tool for vast amounts of data. This information can then be visualized into full business analytics for the project. The service can also be connected to Microsoft’s Power BI that can provide additional analytics in other areas
Here are the capacities of Amazon Web Services:
Predicting business metrics
Ongoing machine learning analysis
Integration of data from different sources
Visualization of key performance indicator
Data storage and encryption
Here are the features Google Data Studio has to offer:
Google ecosystem integration
Advanced monitoring dashboards
Detailed data filtering
Connection to any data source
Dashboard customization
Here’s what Microsoft Azure provides for data:
Visualization with Azure
Dashboards
Integration of other cloud platforms
Machine learning models and tools
Prediction from artificial intelligence
Ongoing data flow analytics
Data visualization benefits
Advanced data analytics and visualization can be a great solution to improve business performance and predict risks. Innowise’s experts list here the main benefits of visuals.
To aid business decision
analysis
It is a great solution for decision-makers as data visualization can make it even easier to explain an idea or make the right choice.
To give a clear picture of business results
Based on the data represented in one report, it is much easier to make an assessment of the state and prospects of the business.
To increase organizational efficiency
Using data visualization, it is possible to identify a weak element easily among departments or employees or to foresee a decrease in efficiency.
To identify causes and trends quickly
With data visualization, it is easier to process information than to study and parse through endless tables of data.
To discover business intelligence insights
Data visualization empowered with artificial intelligence can notify you about interesting ideas for business development and even justify them.
To tell a story through
data
Create a fact-based story using data, visuals, and narrative to clarify your message and help key decision-makers focus on what matters most.
Do you want to reconsider the history of your business or predict future risks?
Take advantage of data visualization consulting services from business
DFAR uses the most advanced and reliable data visualization tools and solutions for business needs. They can become an efficient solution for visualizing data in different ways depending on your project. Our experts favor the following best data visualization tools listed below.
Pie chart
Bar chart
Line chart
Histogram
Gantt chart
Heat map
Choropleth map
Funnel chart
Network diagrams
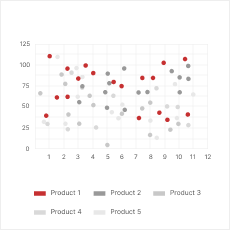
Scatterplot
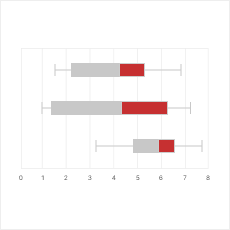
Box and whisker plot
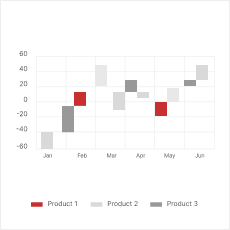
Waterfall chart
Area chart
Correlation matrix
Pivot table
Cost of data visualization services
The exact price obviously depends on the client’s needs and the complexity of the project. There are several factors such as the tools used, functionality, timing of implementation, and many others. Also, the cost of data visualization depends on the location of the developers. In CEE and Baltic regions, the cost is cheaper, and the quality is at the level of the U.S./Western Europe.
Would you like to get services from a data visualization company to improve your business analytics experience?
Use the services of our company to get the top result soon
Our company has been providing exceptionally high-quality data visualization services for a variety of businesses for years. Our professionals are well versed in various BI and data analytics software such as Tableau, Microsoft Power BI, Google Data Studio, Looker, and many others. We successfully apply our experience in eCommerce, financial, manufacturing and other industries.
FAQ
What is data visualization in business analytics?
Terabytes of different data from various sources can be transformed into user-friendly charts, graphs, maps, and other types of visuals. They can also be modified or customized to adapt to any user request.
How long does it take to make a data visualization?
As usual, it all depends on how old your business is and from which point in the timeline you want to visualize your data.
How can data visualization improve decision-making?
The human eye is much faster in processing a picture for accurate analysis rather than researching endless tables of data. Therefore, difficult decisions are easier to make after a detailed visualization report.